Reshoring Initiative Data Report: Reshoring and FDI Boost US Manufacturing in 2015
Introduction
This report contains data on trends in U.S. reshoring and FDI (Foreign Direst Investment) by companies that have returned or added new U.S. production from offshore. The first section of the report, Group A, contains data cumulative thru 2015. The second section, Group B, shows data for 2015 only. See chart sources to confirm the specific years represented. All data is for the U.S. only, unless otherwise noted.
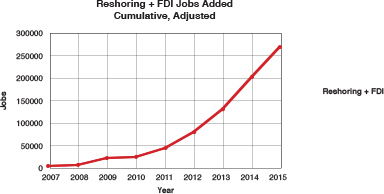
The combined reshoring and related FDI trends continued strong in 2015, adding 68,000 jobs and bringing the total number of manufacturing jobs brought from offshore to over 249,000 since the manufacturing employment low of 2010.
The trend was off 6% in 2015 due to: the strong dollar; low oil prices and shipping rates; and most competitor countries having weaker economies than the U.S.
Data Chart Index
Group A1: Reshoring Trends, Cumulative Totals
- Reshored + FDI Manufacturing Jobs: The Bleeding Has Stopped – table
- Reshored + FDI Manufacturing Jobs, cumulative adjusted 2007-2015
- Reshoring + FDI by Tech Level, 2010-2015
- Reasons Cited for Reshoring + FDI, 2007-2015
- Reshoring + FDI by Industry, 2010-2015
- Reshoring + FDI by Country from, 2010-2015
- Reshoring + FDI by International Region From, 2010-2015
- Reshoring + FDI Cases by State, 2010-2015
- Reshoring + FDI by U.S. Region, 2010-2015
- International Summary – Cases of Reshoring + FDI outside the U.S.
- Nearshoring, Cumulative 2010-2015
Group B: Reshoring Trends, 2015 only
- Reshoring + FDI by Tech Level
- Reasons Cited for Reshoring + FDI
- Reshoring + FDI by Industry
- Reshoring + FDI by Country From
- Reshoring + FDI by International Region From
- Reshoring + FDI Cases by State
- Reshoring + FDI by U.S. Region
- Nearshoring 2015
1 The data for these reports comes from: the Reshoring Initiative's Reshoring Library of approx. 3000 published articles; privately submitted Reshoring Case Studies; and some other privately documented cases. Reshoring and FDI (Foreign Direct Investment) are both motivated by the same logic: the financial advantages the company achieves by producing near the consumer.
Group A2: Reshoring Trends, Cumulative Totals
1. Reshored + FDI Manufacturing Jobs: The Bleeding Has Stopped
The bleeding of manufacturing jobs to offshore has stopped. In the last decade the U.S. has gone from losing about 220,000 manufacturing jobs per year to breakeven. There are still 3 to 4 million manufacturing jobs offshore, a huge potential for U.S. economic growth.

We have found no one systematically tracking offshoring. We have made rough offshoring estimates based on the changes in the level of imports using relationships developed using mfg. employment and import data from the period 2000 to 2007.
2 The data for these reports comes from: the Reshoring Initiative's Reshoring Library of approx. 3000 published articles; privately submitted Reshoring Case Studies; and some other privately documented cases. Reshoring and FDI (Foreign Direct Investment) are both motivated by the same logic: the financial advantages the company achieves by producing near the consumer.
2. Reshored + FDI Manufacturing Jobs, cumulative adjusted 2007-2015
The trend continued in 2015.
3. Reshoring + FDI by Tech Level, Cumulative
It is generally agreed that high tech manufacturing jobs are more desirable than low-tech: more investment, more R&D, higher pay, less risk of loss to low wage countries, etc. Reshoring is moderately more prevalent in higher tech.

Ratings are based on classifications derived from NSF (http://www.nsf.gov/statistics/seind12/c6/c6s.htm#sb5) and OECD systems (http://www.oecd-ilibrary.org/science-and-technology/revision-of-the-high-technology-sector-and-product-classification_134337307632).
4. Reasons Cited for Reshoring + FDI, 2007-2015
Understanding the reasons for reshoring is necessary for companies to proceed to quantifying those reasons. The reasons for reshoring and FDI are similar with the following exceptions. Reshoring places higher emphasis on Made in USA image, automation and re-design of the product. FDI places more emphasis on government incentives and skilled workforce. Since reshoring is almost all from low-wage countries, the companies have to minimize labor cost here to enable reshoring and can provide more perceived increase in value by offering Made in USA branding. Since most FDI is from other developed countries, Made in USA is a less powerful sales argument. Foreign companies can be recruited by all 50 states and often have larger projects, thus they receive and benefit from more government incentives.
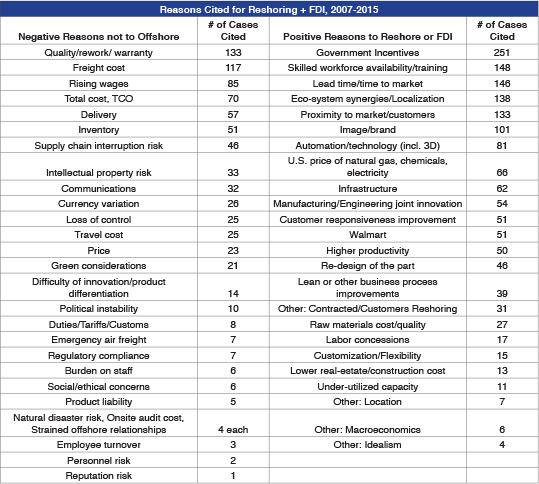
Note: Many of the positive and negative reasons are manifestations of proximity, e.g. inventory, travel, risk, communications, etc.
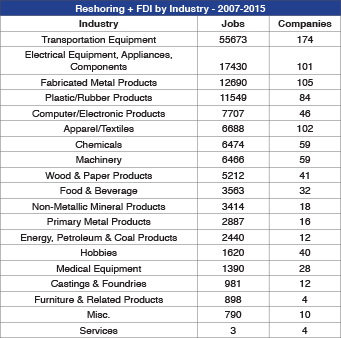
5. Reshoring + FDI by Industry - 2007-2015
Only products that have been imported can be reshored. Thus, the products least suitable for offshoring never left, such as heavy high volume minerals or customized automation systems. The most active reshoring is by those that left and probably should not have done so, including machinery, transportation equipment and appliances.
The table below is primarily sorted by 3-digit NAICS code industry. We also break out several active industries that are in the NAICS Miscellaneous Manufacturing category. Generally, reshoring is focused on products whose size and weight suggest offshoring never offered great Total Cost savings.
The Reshoring Initiative tracks actual cases of reshoring. Interestingly, five of our top six industries correlate with the list of seven Tipping Point Industries3 that Boston Consulting Group's analytical studies project to be reshored based on wage rates, productivity, total cost, etc.
FDI is more heavily weighted towards transportation equipment because of the ongoing investment in automotive assembly plants and related suppliers. It also benefits the most from the Government Incentives.
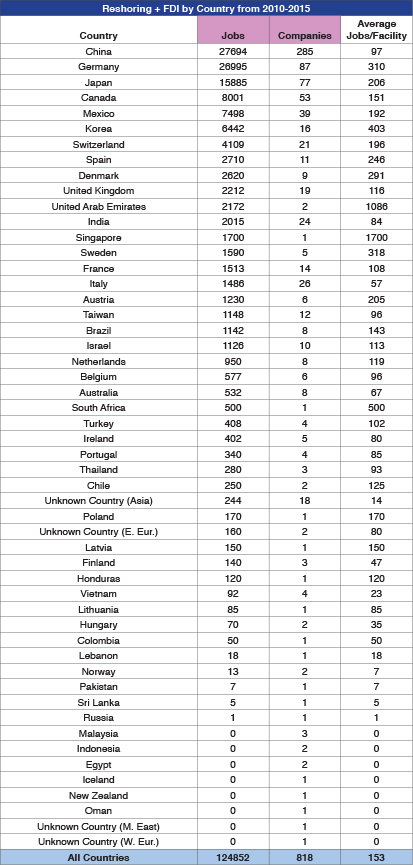
6. Reshoring + FDI by Country from 2010-2015
Reshoring is about 60% from China. FDI is heavily from Germany and Japan.
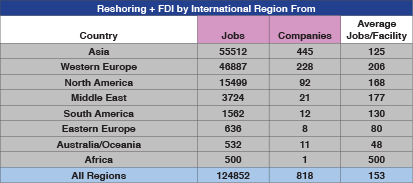
7. Reshoring + FDI by International Region From
Most reshoring is from Asia, most FDI is from Western Europe.
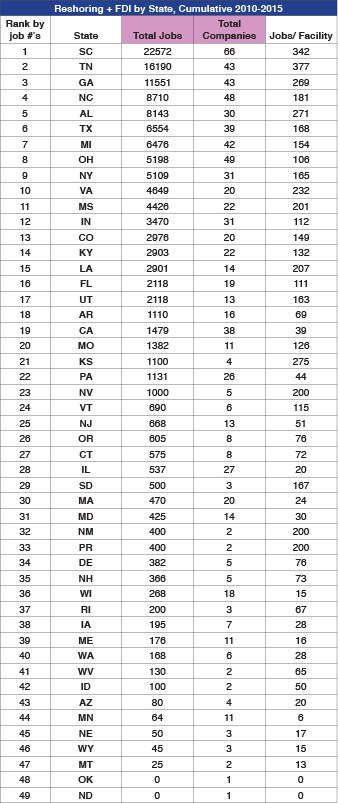
8. Reshoring + FDI Cases by State
The largest reshoring projects tend to go into the Southeast and Texas. The Midwest is second based on reshoring to its strong industrial base.
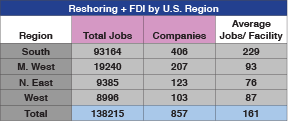
9. Reshoring + FDI by U.S. Region
10. International Summary –Cases of Reshoring + FDI outside the U.S.
Reshoring is bringing the work back to the home country, especially to be sold in the home country. Reshoring efforts are underway in many countries, sometimes motivated by government actions. The U.K. appears to be the leader outside of the U.S.
11. Nearshoring, Cumulative 2010-2015
Nearshoring (in our case, mostly bringing work back to Mexico) benefits the U.S. because more components are sourced from the U.S. in Mexican production than in Asian. Our data is not as complete for Nearshoring because it less often reported in US news sources.

Group B: Reshoring = FDI, 2015 Only
1. Reshoring + FDI by Tech Level
A lower percentage of reshoring and of FDI was high tech in 2015 than in earlier years.

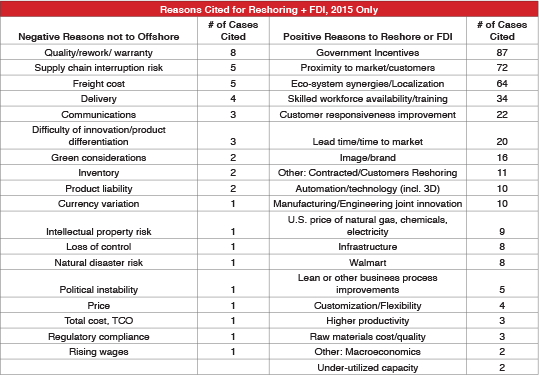
2. Reasons Cited for Reshoring + FDI, 2015 Only
In comparison to cumulative data Negative reasons not to offshore in 2015 remained similar, with the exception of an increased in supply chain interruption. The ratio of citings of Positive reasons remained similar. Companies continue to report more on positive U.S. reasons than negative offshore reasons.
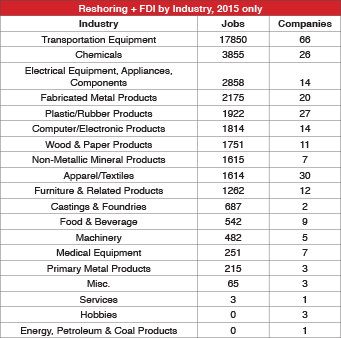
3. Reshoring + FDI by Industry, 2015 only
Transportation equipment remained at the top of the list, due mostly to FDI. Chemicals showed the largest gain in 2015, moving from 7th to second place, probably due to shale gas. Apparel, though not ranked high on job numbers, reported the second highest number of companies returning.
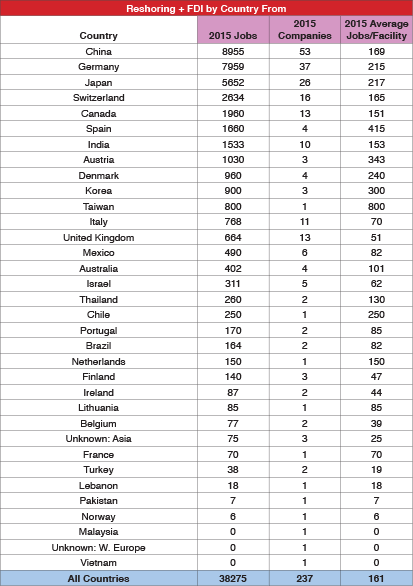
4. Reshoring + FDI by Country From
As in the cumulative data, China leads in reshoring and Germany in FDI
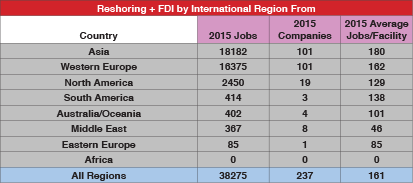
5. Reshoring + FDI by International Region From
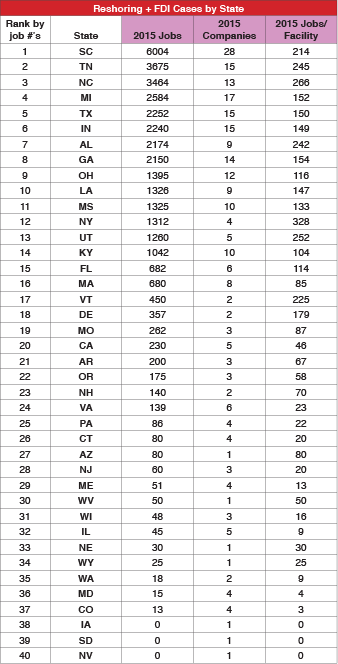
6. Reshoring + FDI Cases by State
The Southeast continues to lead. Michigan, Indiana and Ohio are high mainly due to automotive.
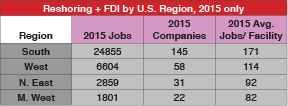
7. Reshoring + FDI by U.S. Region, 2015 only
The south continues to gain the most jobs. The most notable change in 2015 is that the West has displaced the Midwest as the second highest region.
8. Nearshoring 2015 only
This is what we know. We don't capture as much data about nearshoring due to less US reporting on the subject. We would appreciate hearing about more cases that other people know about.

Conclusion
Reshoring is still in its early stages. The purpose of this report is to provide trend data, which should motivate companies to reevaluate their sourcing and siting decisions and make better decisions that consider all of the cost, risk and strategic impacts flowing from those decisions. Recently FDI has been stronger than reshoring. Both trends are based on the logic of localization, producing in the market.
2016 Projections
2016 trends will depend on the USD and the strength of the U.S. economy relative to competitor countries. The strong USD hurts both trends. The strong U.S. economy probably hurts reshoring more than FDI as foreign companies act to increase their position in a strong market such as the U.S. In contrast U.S. companies are largely making sourcing decisions on a cost basis. There is probably a 12 month lag time between these changes and a significant response in the trends. Balancing those headwinds, reshoring and FDI continue to gain credibility - companies are becoming more aware of TCO, and skilled workforce recruitment and training are improving. Due to the strong currency and relatively strong U.S. economy throughout 2015, it will be an uphill fight in 2016. Best guess forecast: 2016 reshoring and FDI drop by 20% vs. 2015. We encourage readers to use our data and tools to help the U.S. improve our forecast.
Data refinement is ongoing.
- To see a full list of companies in the database click here.
- If your company is listed, email us to request your company's data to review, edit and return. Please include your company name and detailed contact info.
- To add your company, go to the Reshoring Initiative's database entry form.

