Reshoring Initiative 2018 Data Report: A Record 1389 Companies Announce the return of 145,000 Jobs
(View in pdf format here)
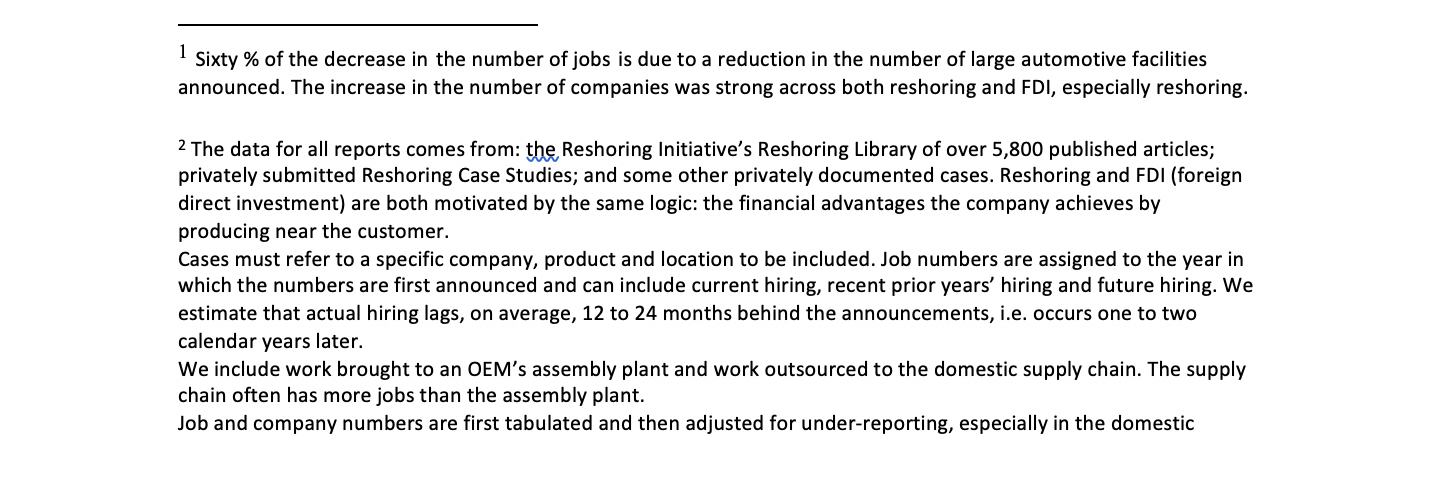
IntroductionIn 2018 the combined reshoring and related foreign direct investment (FDI) announcements remained strong, adding more than 145,000 jobs, with an additional 36,000 in revisions to the years 2010 through 2017. This brings the total number of announced manufacturing jobs brought to the U.S. from offshore to over 757,000 since the manufacturing employment low of 2010.
Although the 2018 number of jobs announced was down 15% compared to 2017’s pre-revision rate, it is the second highest annual rate on record. Additionally, the number of companies reporting new reshoring and FDI was at the highest level in history, up 38% from 2017 to 1389 companies.[1] The continued strength in jobs and number of companies demonstrates a tangible shift in corporate decision making that is likely to propagate the trend of reshoring and greater localization into the future.
This report contains data on trends in U.S. reshoring announcements by U.S. headquartered companies and FDI by foreign companies that have shifted production or sourcing from offshore to the U.S. The data is cumulative 2010 through 2018 and is for the U.S. only, unless otherwise noted.
Data Index
Reshoring and FDI Trends, Cumulative 2010-2018 Totals[2]1. Cumulative Manufacturing Jobs
2. Manufacturing Job Announcements by Year 3. Factors Cited 4. Industry 5. Tech Level 6. Countries From 7. International Regions From 8. State 9. U.S. Region 10. Nearshoring 11. 2019 Trends and ProjectionsAll data is for reshoring plus FDI, 2010 to 2018, unless otherwise noted in the text.
 _______________________________________________________________________________ 1. Cumulative Manufacturing Jobs
 In 2018 job announcements due to reshoring and FDI reached the second highest annual rate in history. The cumulative announcement of more than three-quarters of a million jobs since 2010 has driven 31% of the total increase in U.S. manufacturing jobs during that period and 3.3% of total 12/31/18 manufacturing employment of 12.8 million. [3]
We believe the continued increases are largely based on greater U.S. competitiveness due to corporate tax and regulatory cuts and increased recognition of the total cost of offshoring.
________________
Reshoring and imports both increased in 2018
Progress is, however, relative. While 2018 showed strong reshoring job announcements, the U.S. also saw a simultaneous large increase in non-petroleum goods imports, up $140 billion from 2016.
Reshoring was strong despite imports increasing in 2018. In 2015 we determined that parity was reached between offshoring (calculated from an increase in imports) and returning jobs, indicating that the net bleeding of manufacturing jobs to offshore had stopped. In 2016, for the first time since 1970, we reshored more jobs than we lost to offshoring. The U.S. had gone from losing net about 220,000 manufacturing jobs per year at the beginning of the last decade to adding net 30,000 jobs in 2016.
There is no measure of offshoring announcements or implementation. We did not observe a high rate of announcements of offshoring. We believe that the increase in imports was primarily due to increased imports of the same products, rather than additional U.S. production being offshored. The increase in imports may be explained by the following factors:
1. Higher volume of the same items: U.S. economy was the strongest in the developed world, drawing in more imports. 2. Higher prices for the same items: Emerging market wages continued to rise, raising the $ cost of imports. 3. Impending tariffs: Companies accelerated shipments to get ahead of the 25% tariff rate scheduled for year-end 2018 on most Chinese products. When measured by our trade deficit of about $500 billion/year, there are still three to four million U.S. manufacturing jobs offshore at current levels of U.S. productivity, representing a huge potential for U.S. economic growth. Measured by our $800 billion non-petroleum goods trade deficit there are about five million still offshore.The trend in U.S. manufacturing employment, as per Exhibit 1c, is the best evidence that a combination of less offshoring and more reshoring and FDI is working. The chart shows a regression line from 1997, before China joined the WTO, to 2006, before the great recession. If the trend had continued, U.S. manufacturing employment would be three million jobs lower than the actual level today.
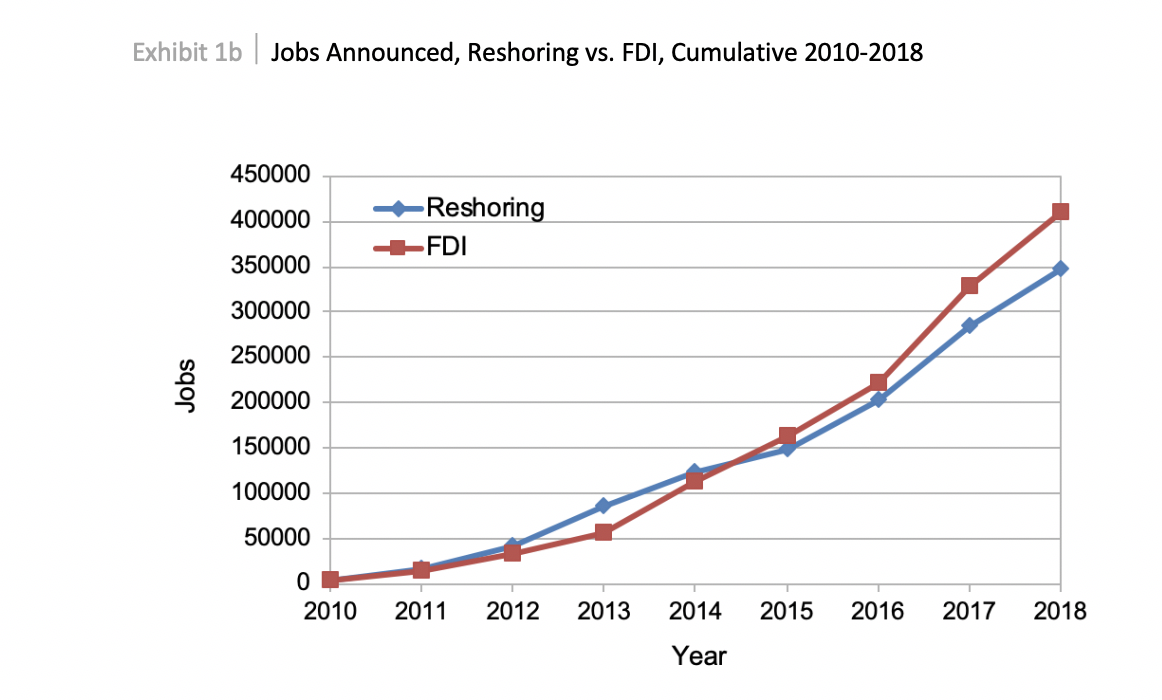
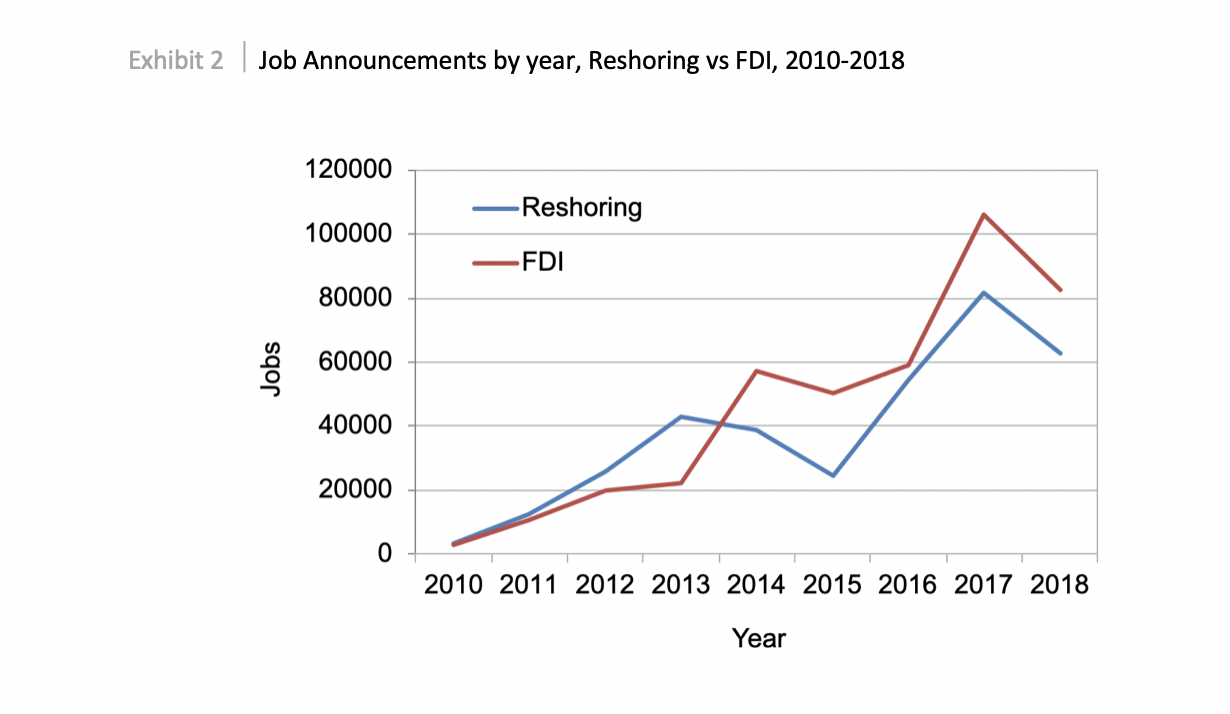
2. Job Announcements by Year, Reshoring and FDI
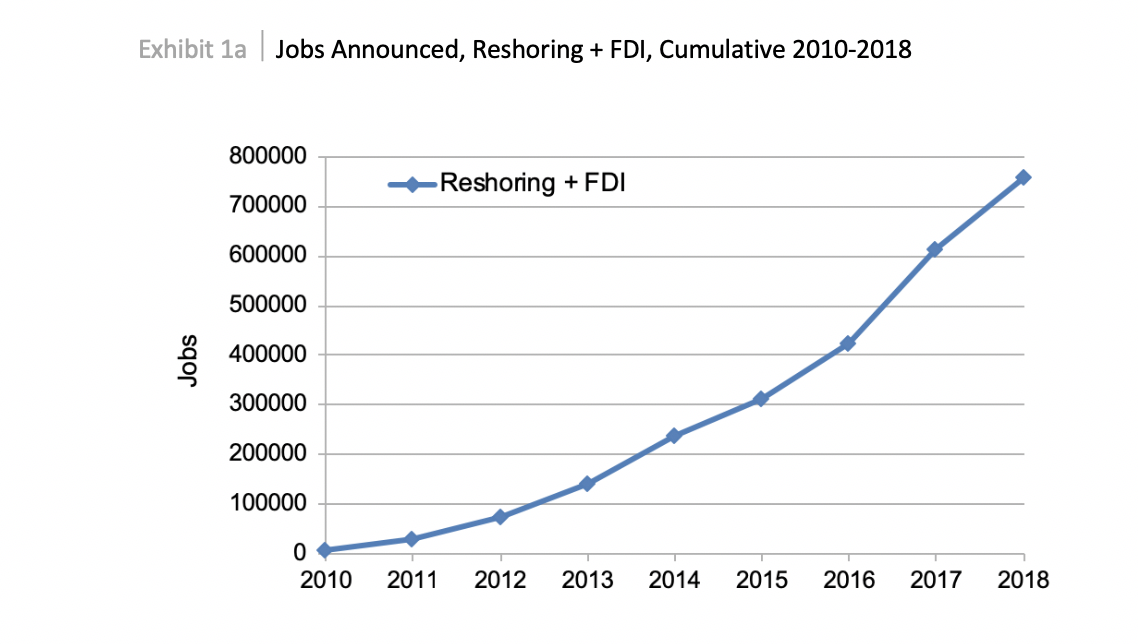
Similar to the previous few years, FDI continued to exceed reshoring in terms of total jobs added, but reshoring has continued to close the gap since 2015. The fact that reshoring has been progressing at a similar rate as FDI since 2016 indicates that U.S. headquartered companies are starting to understand the same benefit to U.S. production that foreign companies have understood over the last few years.
We anticipate subsequent upward revisions of the 2018 totals. 2017 totals were increased by 11% in 2018 (171k to 189k) as new announcements from the earlier year were found or published later in the following year.
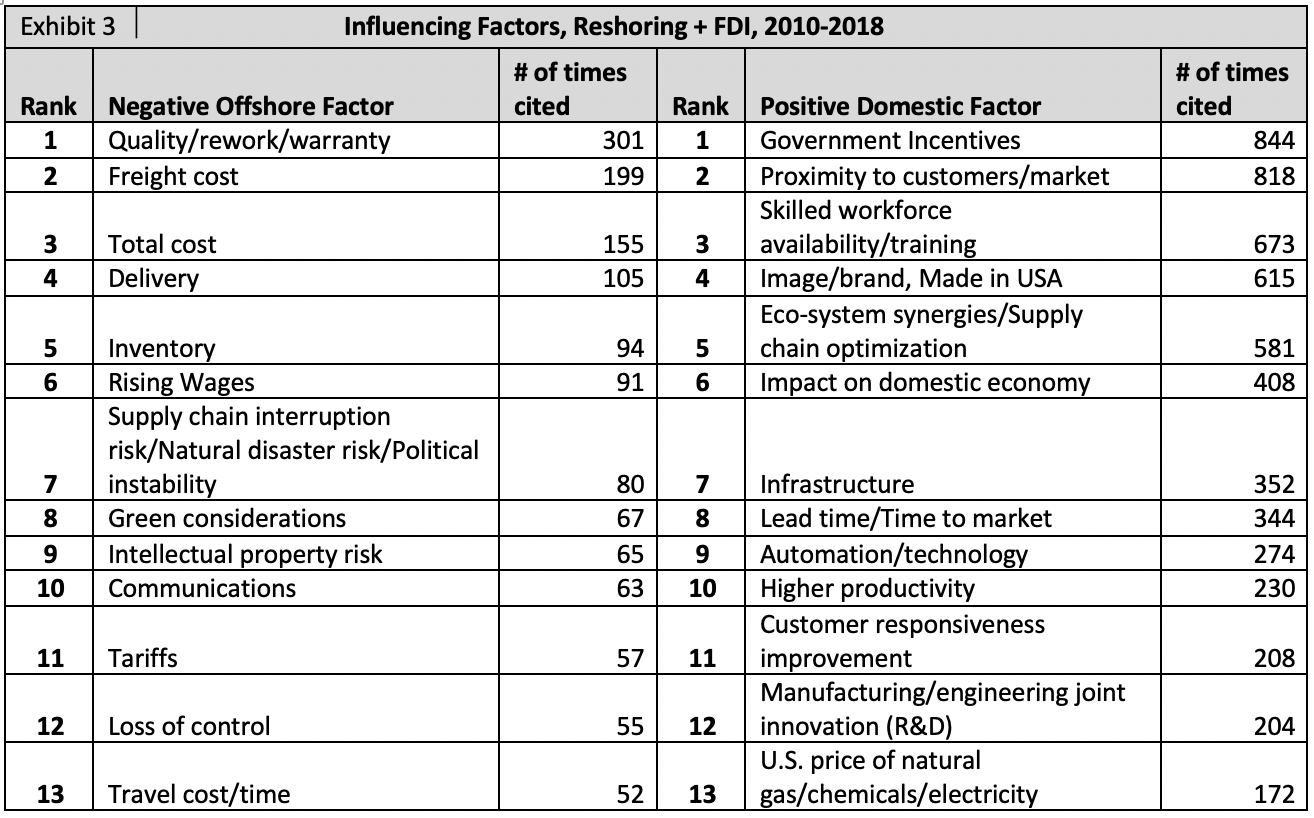
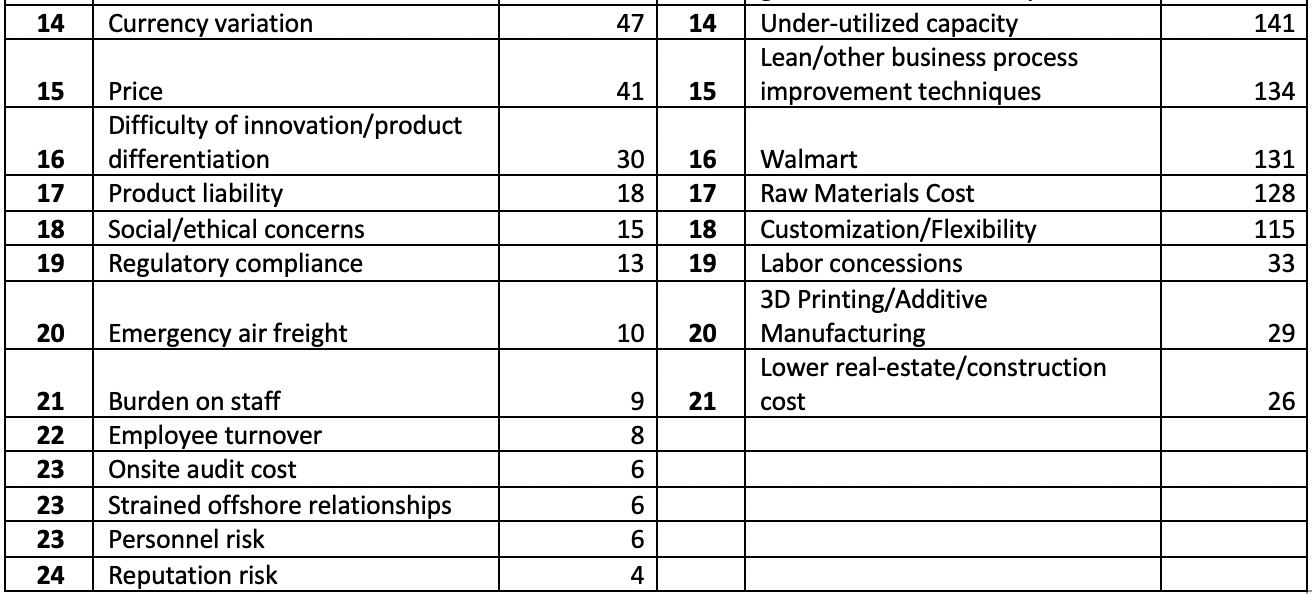
3. Factors Cited for Reshoring + FDI
About 60% of companies decided to offshore based on comparing wage rates, ex-works prices or landed costs. Much of the strength of the reshoring trend has been due to companies becoming familiar with a broad range of factors (costs and risks) they had previously ignored. Understanding the reasons other companies have given for reshoring helps companies to determine whether those reasons apply to them also. A broad range of costs and risks can be quantified using the Total Cost of Ownership Estimator®.
Positive Factors are the values that attracted the company to their U.S. site and that they achieved here. These factors are similar for reshoring and FDI with the following exceptions. Reshoring places a higher emphasis on Made in USA image, automation and re-design of the product. FDI places more emphasis on government incentives and skilled workforce. Since reshoring is almost all from low-wage countries, reshoring companies automate to make up for higher domestic hourly labor cost. Since most FDI is primarily from other developed countries, Made in USA is a less powerful sales argument. Shifting from Made in Germany to Made in the USA has less brand value than shifting from Made in China. Foreign companies can be recruited by all 50 states and often have larger projects; thus, they receive more government incentives.
Negative Factors are the negative issues experienced offshore. Most of the issues are related to distance: freight, delivery, inventory, etc. Others are country-specific: rising wages, IP risk, political instability, etc.
Companies have consistently reported the Positive Factors more often than the Negative, probably because the companies place more value on demonstrating the wisdom of their current reshoring decision than on what went wrong with their earlier offshoring decision.
Reporting of factors influencing reshoring and FDI has increased every year since 2010, with a year over year increase of 88% in 2018, indicating heightened public interest and industry awareness of the previously “hidden costs”. Impact on Domestic Economy moved up in rank from 11th to 6th. Tariffs moved from 16th to 11th (99% of Tariff citings are for 2016 and later, thus indicating a response to anticipated and actual Trump tariffs.) Trump as a factor was cited in “other reasons” 83 times, often in association with corporate tax cuts and tariffs, which generally support reshoring. Looking forward, Freight cost has always been high on the list, but we expect it and Green considerations to become more relevant as the new emission reduction initiative by the International Maritime Organization is implemented in 2019/2020. Overall, the cumulative top 10 Positive Domestic factors also showed the greatest increases year over year, highlighting the strongest drivers of the trend.
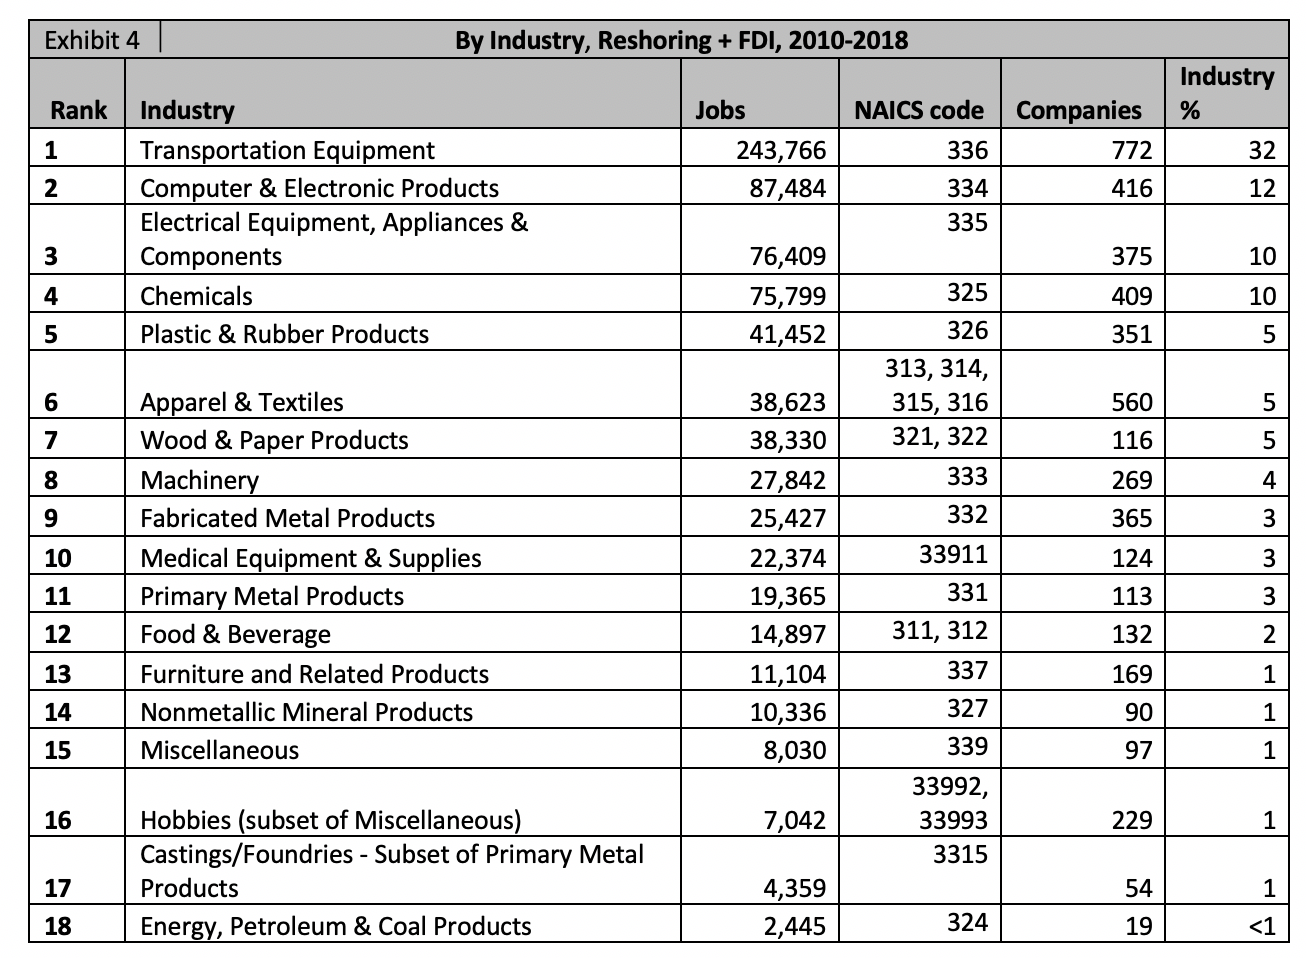
Only products that have been offshored/imported can be reshored. Thus, the products least suitable for offshoring never left, such as heavy, high volume minerals, high mix/low volume items or customized automation systems.
The most active reshoring is by those that left and probably should not have done so, including machinery, transportation equipment and appliances. As the data indicates, reshoring is focused on products whose size and weight, e.g. transportation equipment, or frequency of design change/volatility of demand, e.g. some apparel, suggest that offshoring never offered great total cost savings.
FDI is more heavily weighted towards Transportation Equipment because of the ongoing investment in automotive assembly plants and related suppliers. It also benefits the most from government incentives.
In 2018, Chemicals moved from 6th to 4th place, due to shale and the low price of natural gas. [5] Primary metal products climbed from 11h to 15th, presumably due to the steel and aluminum tariffs.
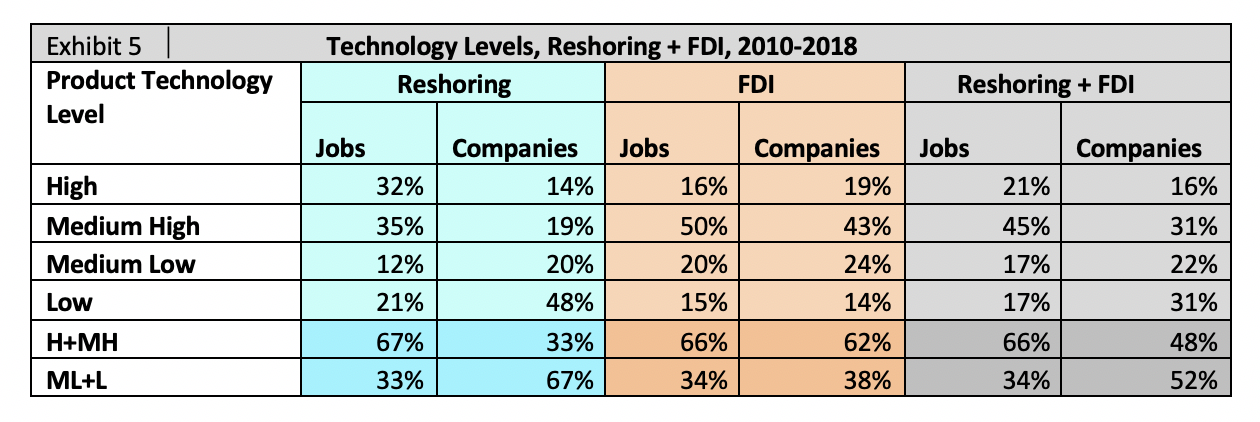
 5. Reshoring + FDI by Technology Level [6] It is generally agreed that manufacturing High-tech products is more desirable than Low-tech: more investment, more R&D, higher pay, less risk of loss to low wage countries, etc. Currently, reshoring and FDI are adding more High-tech jobs than Low-tech. This trend is important since the U.S. has a trade deficit in High-tech products. While High and Medium-High tech are creating the lion’s share of jobs, there has also been a recent uptick in Low-tech companies, due to increases in apparel, wood, and plastic and rubber industries. Reshoring is stronger in High-tech than FDI which is stronger in Medium-High due to the high % of transportation equipment in FDI.
 We encourage the U.S. to become competitive on all tech levels to balance the trade deficit and employ a broader range of workers. High-tech products represent too small a percentage of our consumption to allow the U.S. or any country to focus only on High-tech. The challenge is to upskill our workforce so that more of them can work on more highly automated production of lower-tech products.

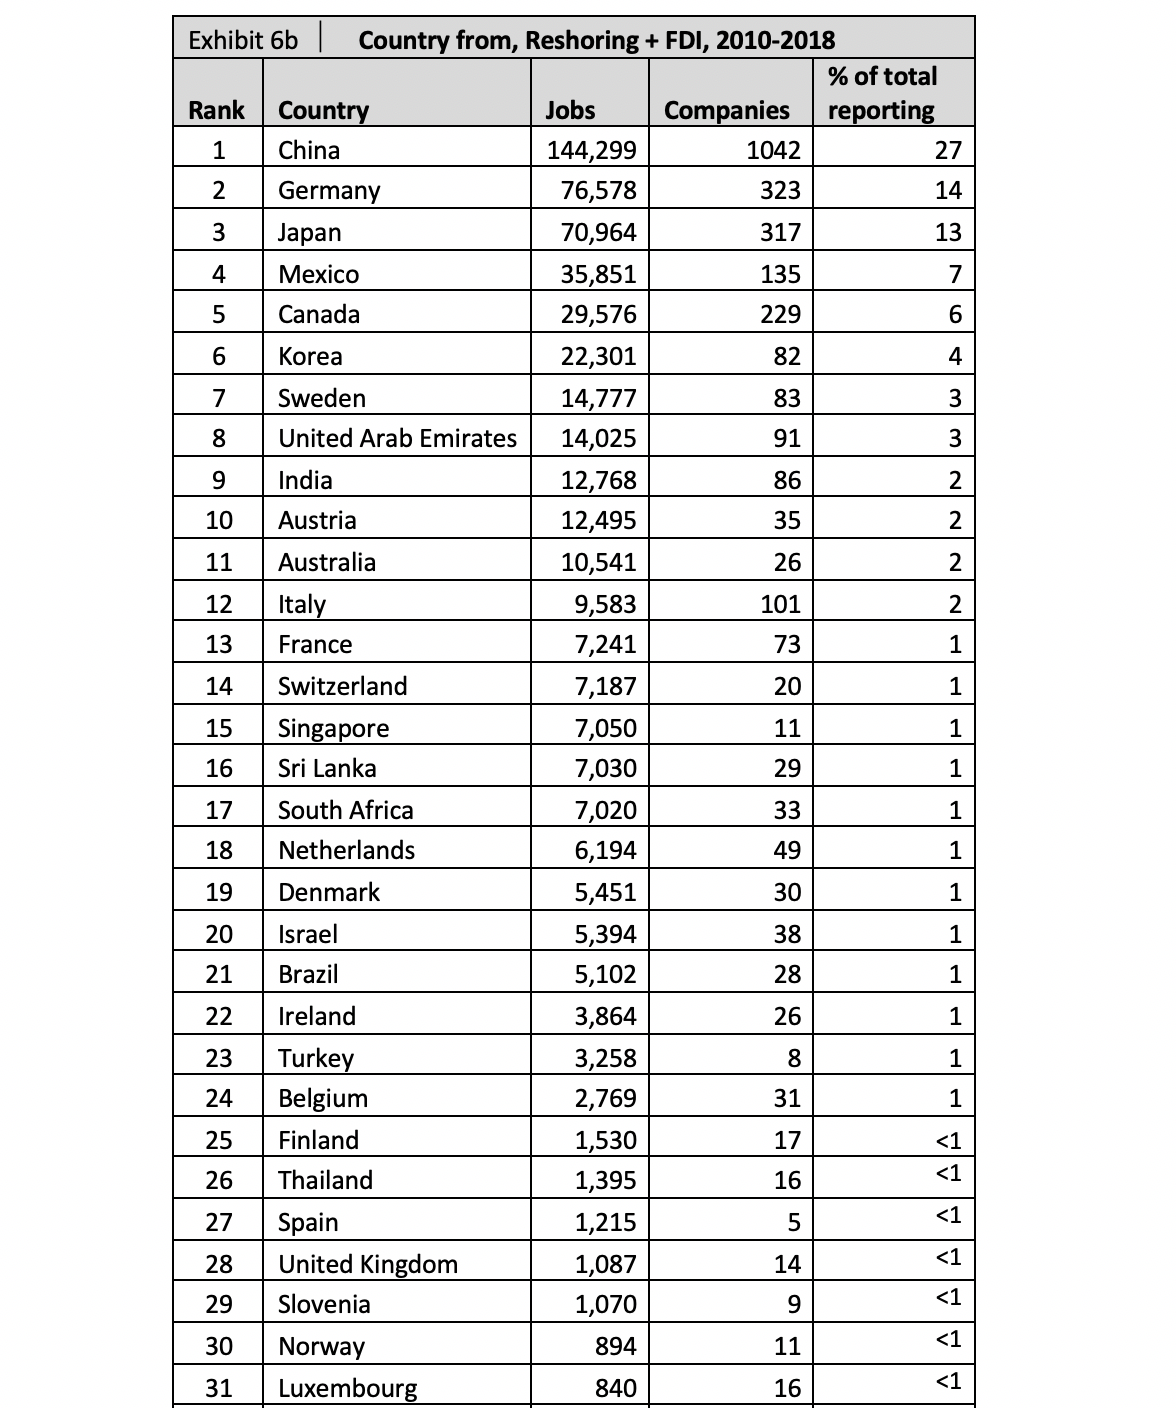
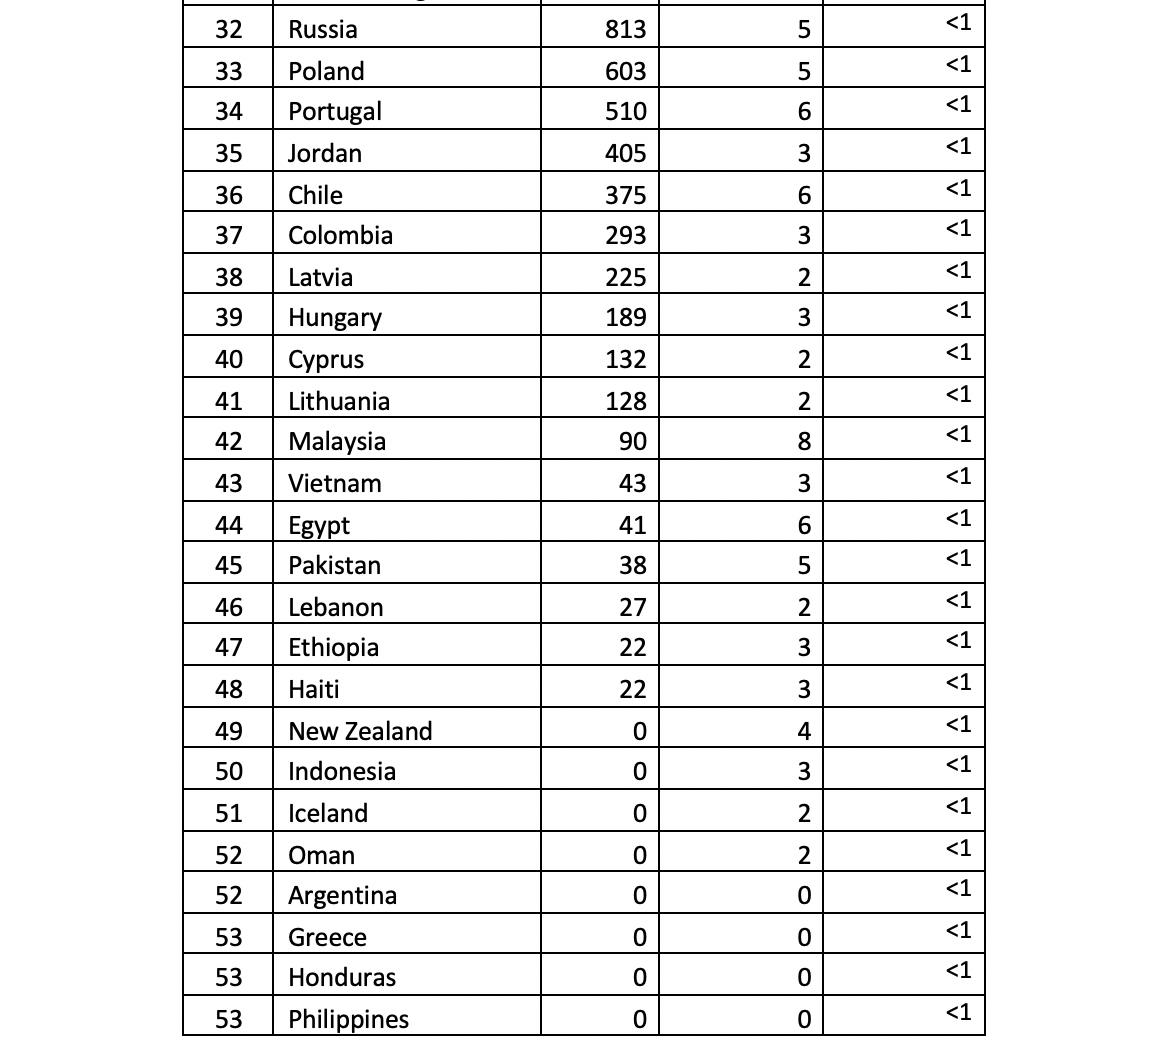
Reshoring is 59% from China, broadly distributed across industry categories. FDI is heavily from Germany (18%) and Japan (15%), both driven by transportation equipment, and more recently China (19%) in a broad range of industries. Reshoring by Country From is underreported since some cases do not mention the country or refer to “Asia” or “returned from offshore.” The rate of reshoring from China dropped in 2018. 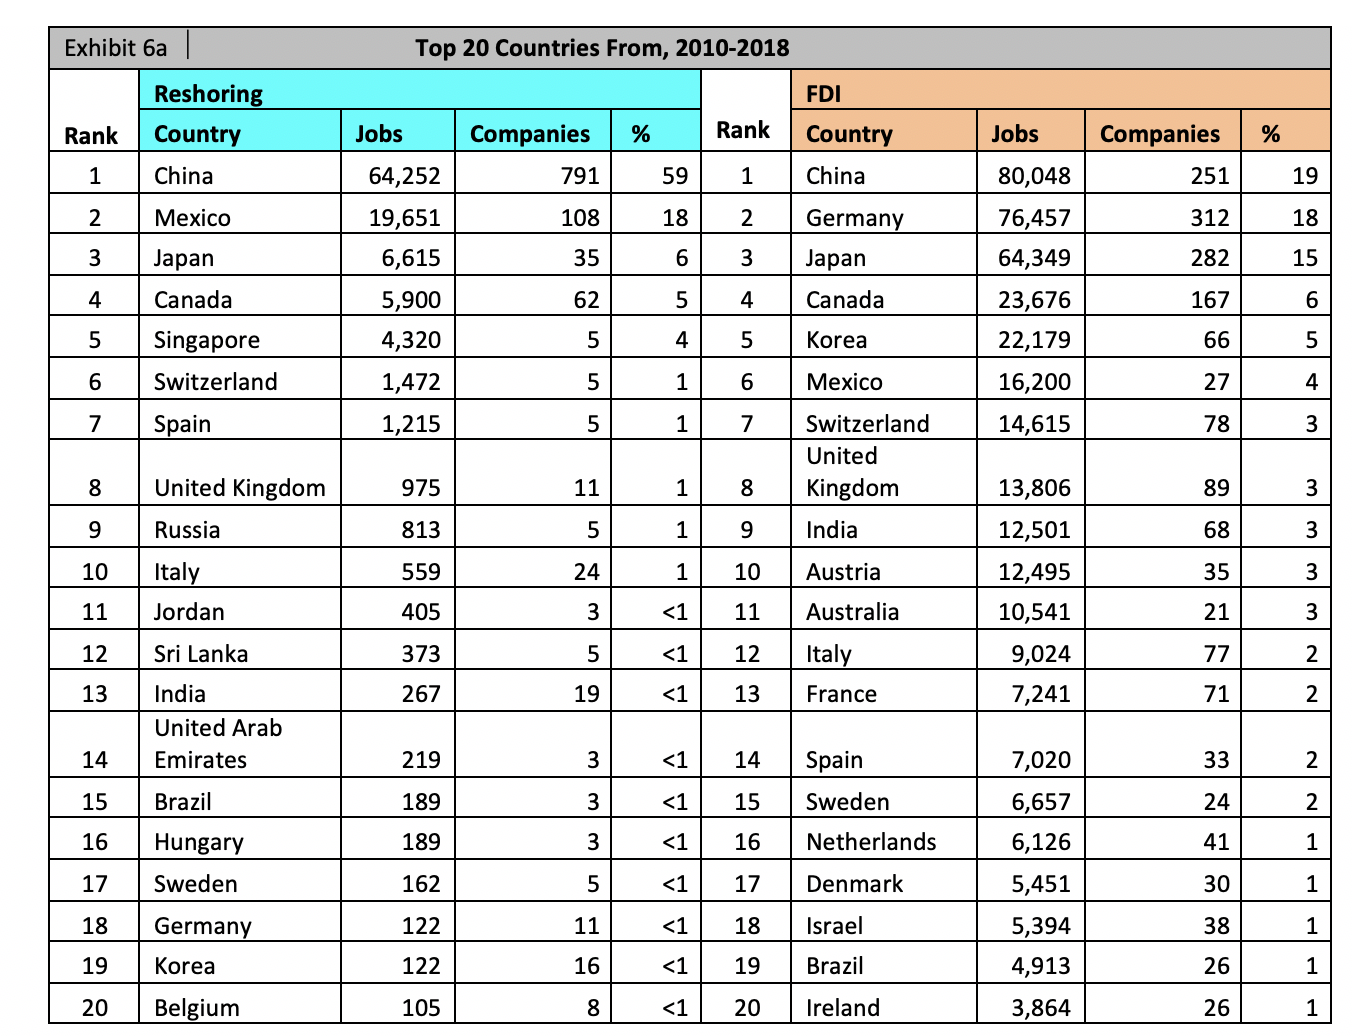
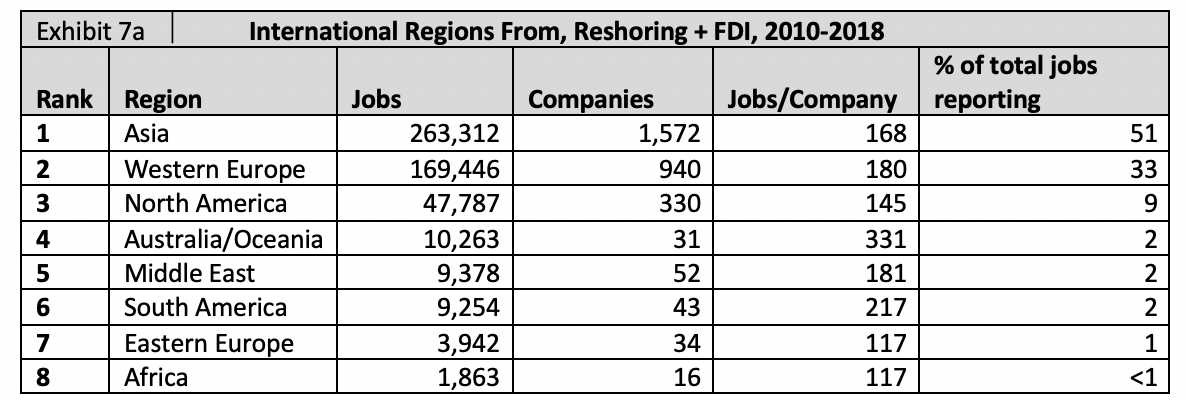
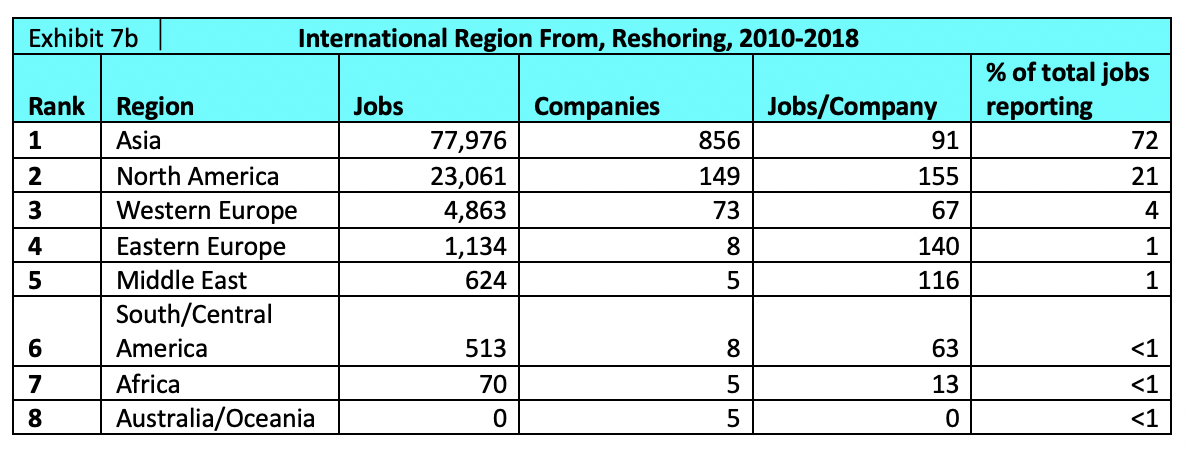
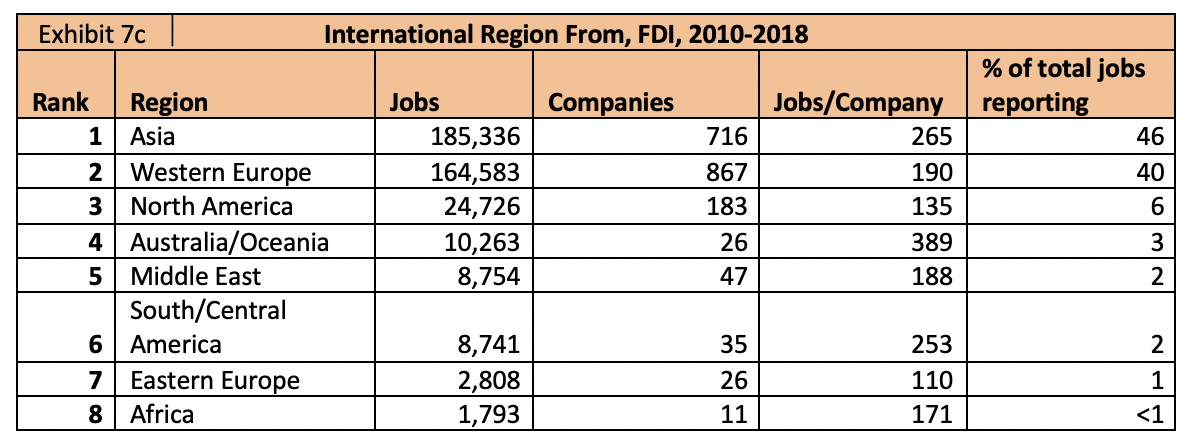
7. Reshoring + FDI by International Regions From
Most reshoring is from Asia. FDI used to come primarily from Western Europe but is now about equally from Asia, due mostly to the increase in Chinese investment.
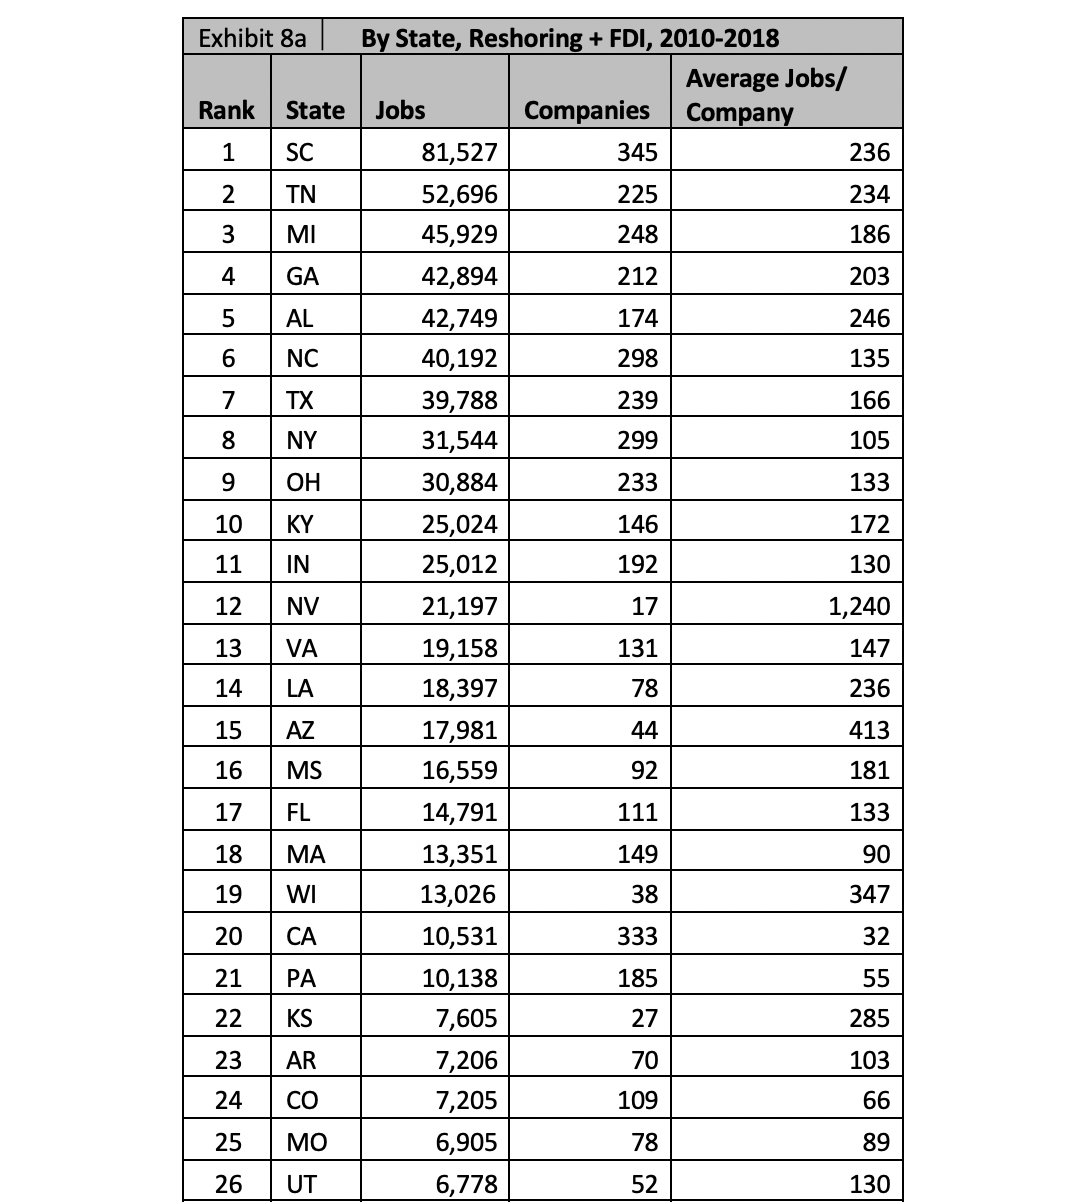
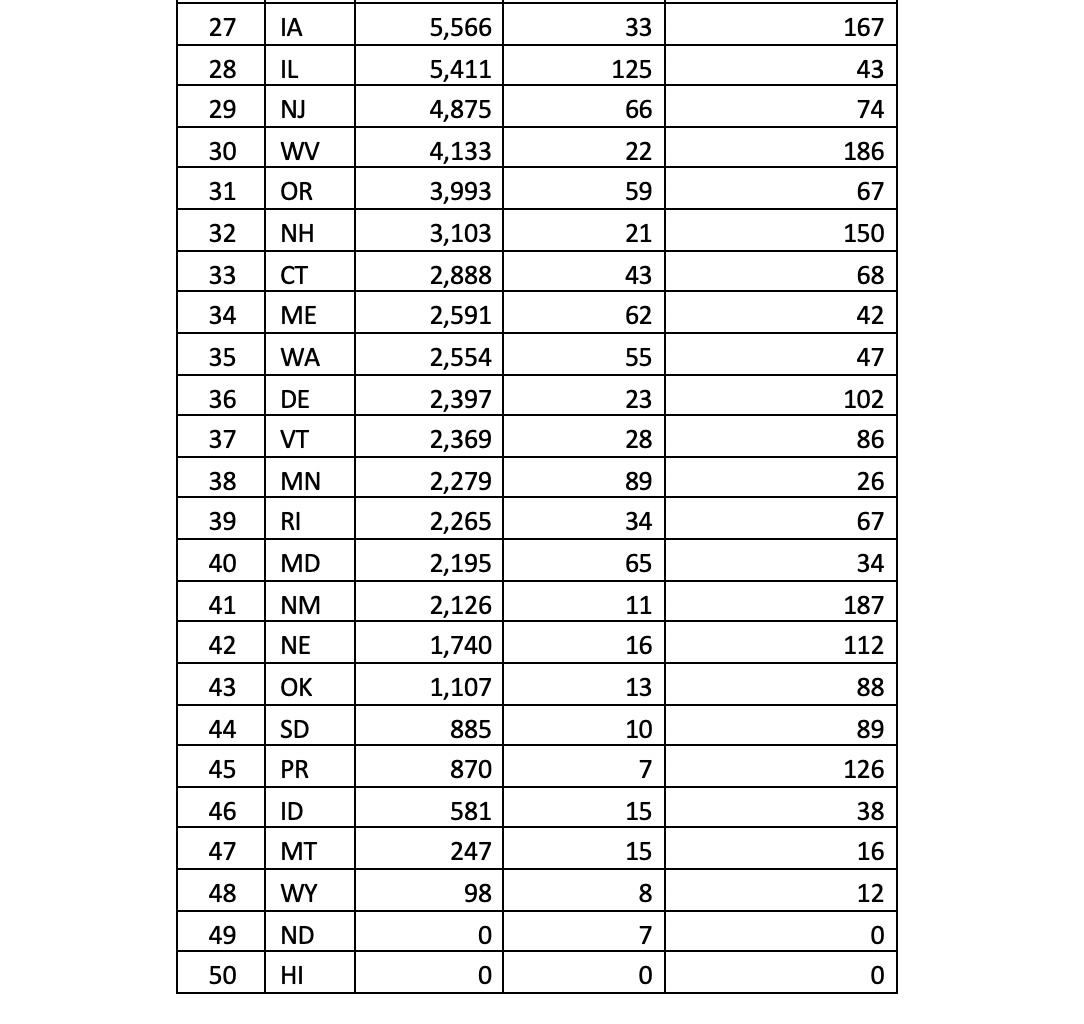
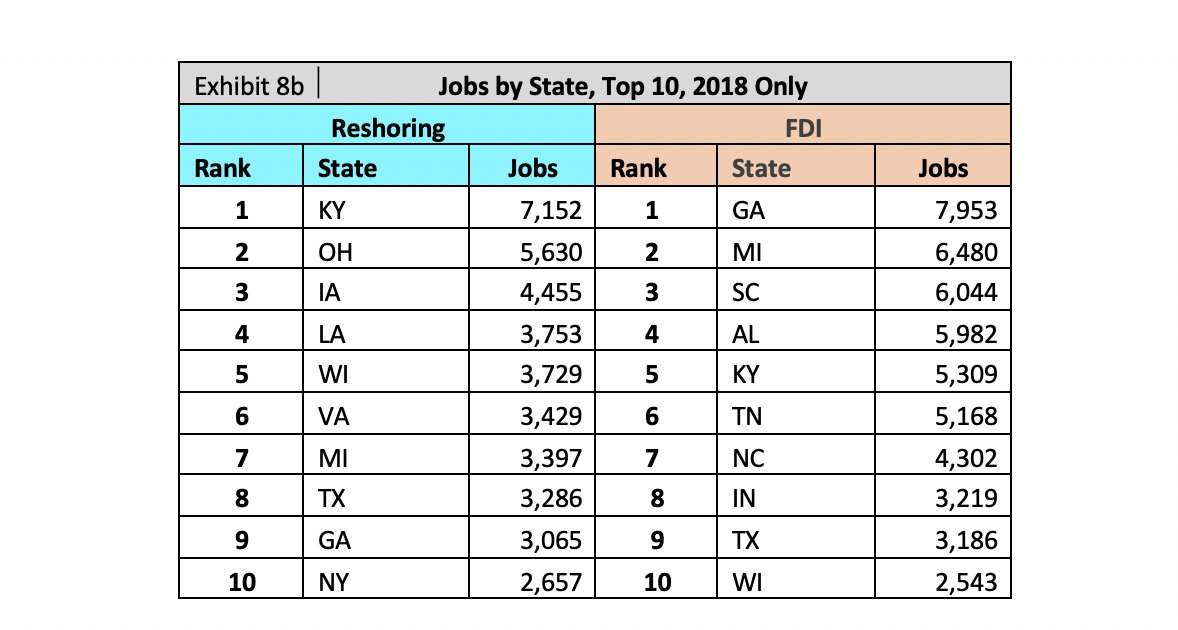
8. Reshoring + FDI Cases by State
The Southeast and Texas get the most and, on average, the largest projects, presumably due to right-to-work laws and typically lower property costs, wage rates, taxes and energy costs. The Midwest, led by Michigan, is second based on reshoring to its strong industrial base. NV moved from 28th to 12th (due to the Tesla/Panasonic lithium battery plant[7]), AL moved from 7th to 5th. KY moved up from 15th to 10th.

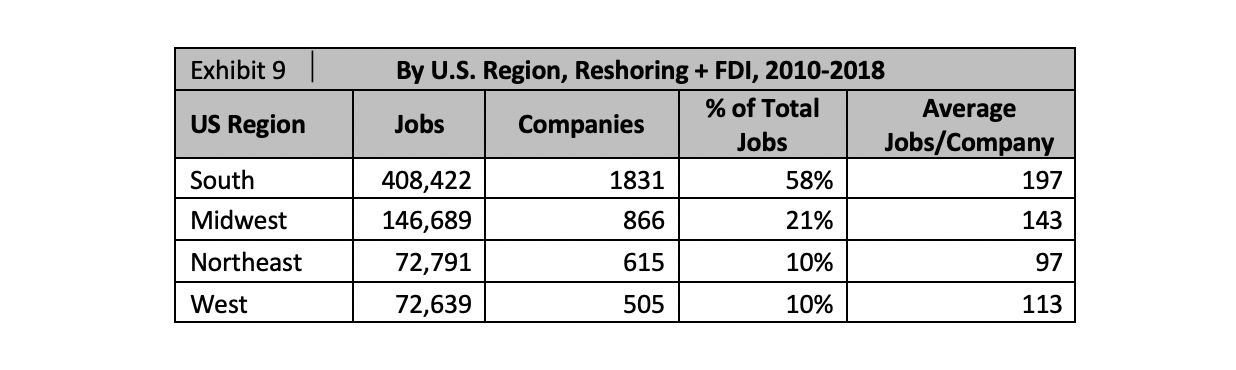
9. Reshoring + FDI by U.S. Region
The South and Midwest continue to dominate. In 2018 the South gave up 2% to the Northeast, bringing the Northeast to just ahead of the West.
10. Nearshoring
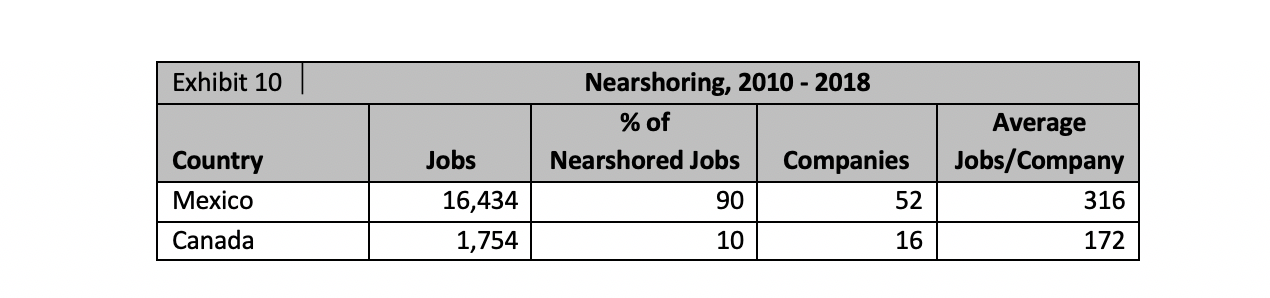 Nearshoring to Mexico or Canada is better for the U.S. than work staying further offshore like Asia. For example, exports from Mexico to the U.S. have 40% U.S. content whereas exports from China have only 5% U.S. content. Transportation equipment and appliances nearshore the most. More companies nearshore to Mexico than to Canada due to greater cost advantages. Our data is not as complete for nearshoring, which is less often reported in U.S. news sources.
 11. 2019 Trends and Projections
As was true for 2018, there is a substantial pipeline of huge projects that have been announced but are not firm enough to be included in our database. These projects include Foxconn in Wisconsin, Apple, SoftBank and numerous shale gas refinery projects. It remains to be seen whether the political climate that motivated some of these announcements can support follow through.
More companies mentioned Impact on Domestic Economy as a factor in their decision in 2018 than in 2010 thru 2017 combined. Companies are starting to appreciate that their continued success requires their home market to be strong.
Like 2018, results in 2019 will depend largely on the stability and follow through of policy changes (taxes, regulations, trade, skilled workforce, tariffs, etc.) implemented by the administration, and corporate responses to those changes. The 2017 upswing in activity was in response to anticipation of such changes, which are expected to continue to positively impact U.S. competitiveness. Below are some factors that may impact 2019 relative to 2018.
Negative forces likely to slow reshoring and FDI:
- The job announcements in anticipation of tax and regulatory reductions may have tapped the immediate opportunities.
- Dysfunction in Washington, DC.
- The shift of control of the U.S. House, resulting in reduced business optimism.
- Concern about the 2020 elections impacting tax rates, regulations, etc.
- Higher USD.
Positive forces likely to help reshoring and FDI:
- How corporate cash flow from repatriation and tax cuts are utilized: investment, training and hiring are helpful. Stock buybacks are much less so.
- World growth recovery will make other markets more attractive for offshore suppliers leaving domestic suppliers with less competition to supply the U.S.
- Continued increases in usage of TCO (Total Cost of Ownership) instead of price in making sourcing decisions.
- Continued reductions in regulations.
- Continued improvement in skilled workforce programs.
- Automation, IoT, Industry 4.0, AI shrinking the unit labor cost gap.
- Improving environmental consciousness. Domestic supply chains are more transparent than offshore and less polluting, cutting the world’s environmental impact by up to 50%, depending on the product. Sustainability practices will continue to increase as a corporate strategy and will help drive reshoring and FDI.
- Recent increases in U.S. investment could lead to greater productivity and innovation.
- Higher interest rates will tend to raise the value of the USD (headwind) but will surely increase the carrying cost of inventory (tailwind), which is increased by offshoring.
- Possible actions on NAFTA/USMCA, tariffs, trade with China, etc. Likely to be favorable but could be temporarily disruptive.
- Oil prices and environmental regulations. Higher prices increase freight costs.
There is probably an average 12-month lag time between the announcement or implementation of policy changes and a significant response in the trends. Best guess forecast: 2019 reshoring and FDI will be flat vs. 2018. Our skilled workforce supply is not yet ready to support a much higher rate of increase.
Conclusion
The rate of reshoring plus FDI job announcements in 2018 was up about 2300% from 2010, representing a major macro-economic impact. This data should motivate companies to further reevaluate their sourcing and siting decisions and make better decisions that consider all of the cost, risk and strategic impacts flowing from those decisions. Policy makers can use the continued successes as proof that it is feasible to bring millions of jobs back. They can use the measured parameters to define local and national strategies to improve competitiveness to accelerate the trend.Continuation of the trend depends on companies reevaluating their offshoring. The Reshoring Initiative offers many tools and resources, which are listed below.
___________________________________________________________________________
Reshoring Initiative ResourcesTotal Cost of Ownership Estimator® - Free online tool that helps companies account for all relevant factors — overhead, balance sheet, risks, corporate strategy and other external and internal business considerations — to determine the true total cost of ownership. It can be used by companies to make smarter sourcing decisions and to sell against imports. Call on the Reshoring Initiative for help using this and other tools.
Competitiveness Toolkit - Designed to quantify and select the optimal national policy changes to bring back the desired number of jobs.
Import Substitution Program (ISP) - Helps manufacturers, trade associations, equipment sellers and economic development organizations identify and quantify the major relevant importers and convince them to reshore. Also helps to identify supply chain gaps to be filled by FDI.
Corporate Social Responsibility Estimator - Provides a model for estimating sourcing decisions’ impact on pollution and on the domestic economy.
Reshoring Library – You can use Advanced Search to identify companies that have reshored or done FDI in relevant industries or regions.
Reshoring Initiative Data Report – Annual reports track the drivers, impact and momentum of the trend.
Data refinement is ongoing.- Companies, industry associations, states, EDOs and others are encouraged to send us information on reshoring and FDI cases. Send us links to articles and announcements, or go to the Reshoring Initiative’s database entry form
- To see a full list of companies in the database click here.
- If your company is listed, email us to request your company’s data to review, edit and return. Please include your company name and detailed contact info.
- Supplements to this report will be published and posted at www.reshorenow.org as they become available.