Reshore Now
Comments (0)
July 30, 2020
Impact of using TCO instead of Price
Most companies make sourcing and plant siting decisions based on wage rates, Ex Works price or Landed Cost. By doing so, they ignore costs and risks whose recognition would cause 10 to 30% of imports to be sourced domestically instead. This page demonstrates the impact of shifting decision metric from price to TCO (Total Cost of Ownership).
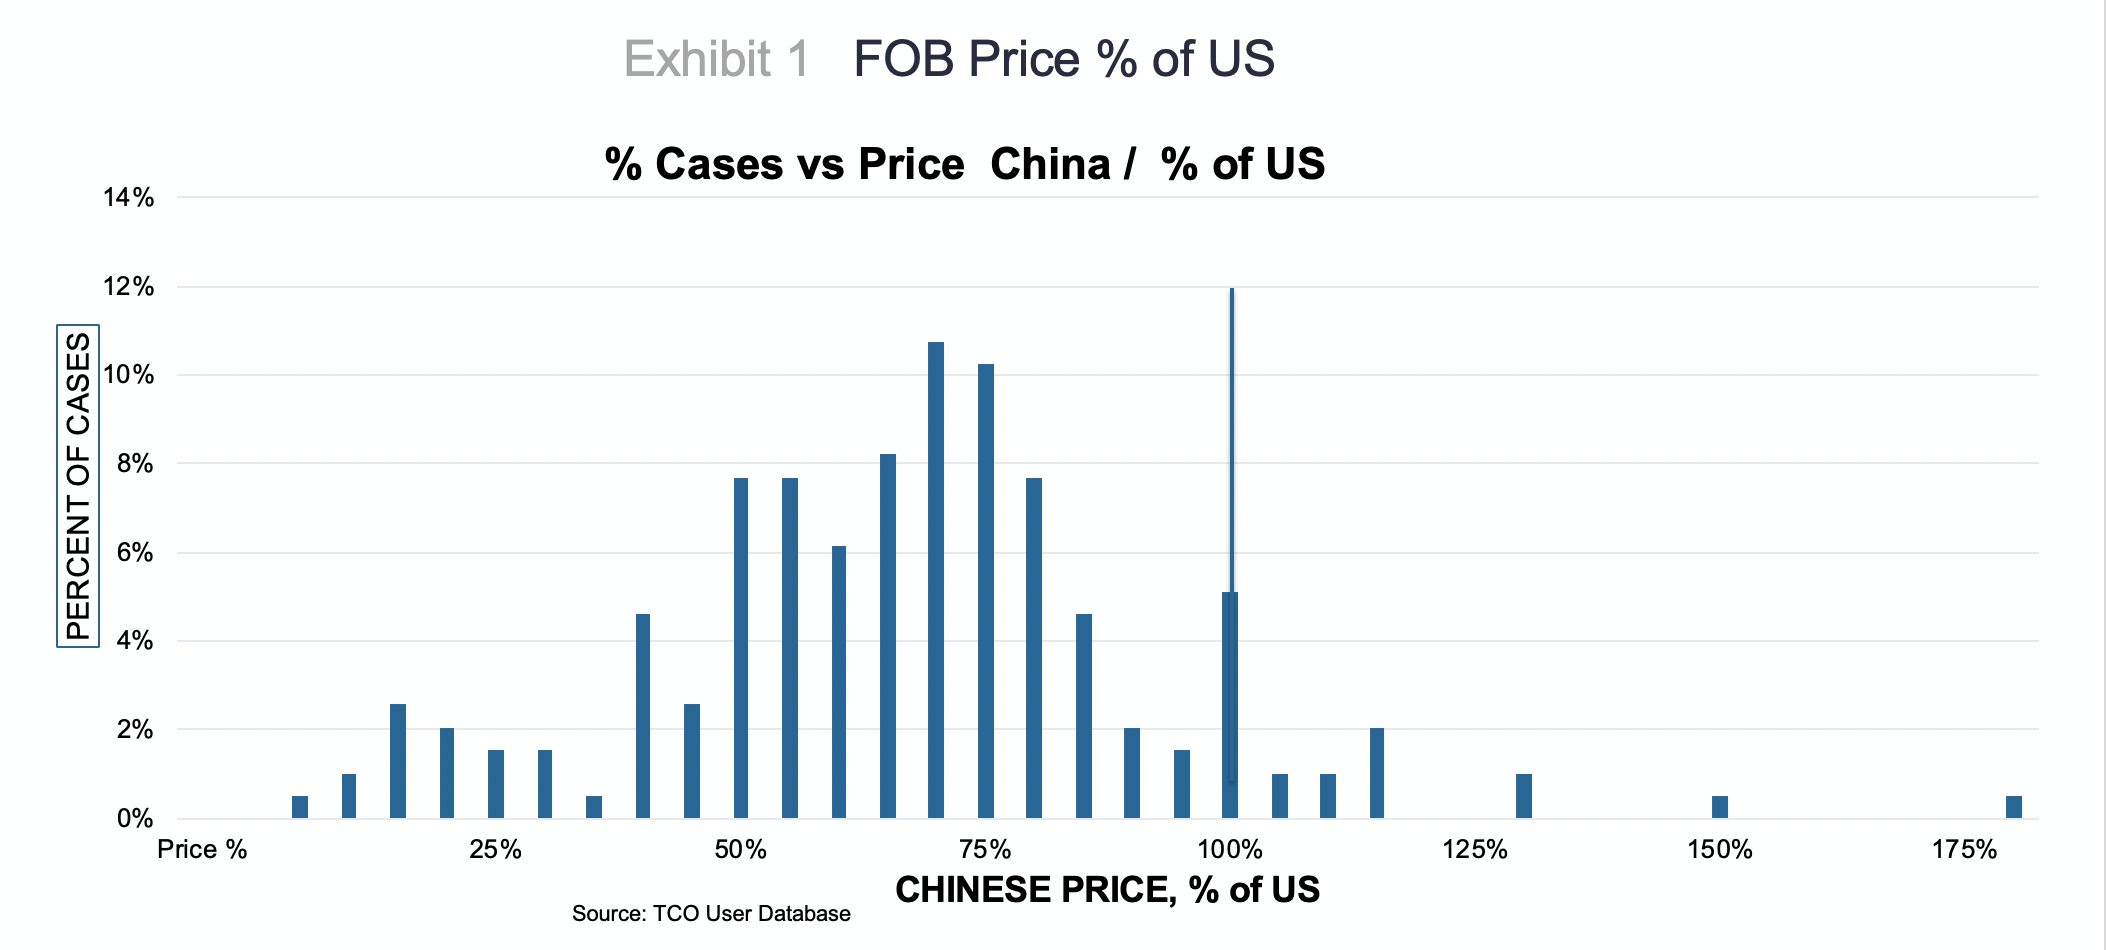
Exhibits 1, 2 and 3 are based on the first 200
TCO Estimator users who, from 2010 to 2017, compared a Chinese source to a U.S. source for a product.
In Exhibit 1 the horizontal axis is Chinese price as a % of U.S. price. The vertical axis is the number of cases. For cases to the left of the vertical 100% line, China has the lower price. To the right, the U.S. has the lower. Chinese Ex Works Price averages about 70% of U.S. price. Looking at this graph one might conclude that reshoring is rarely feasible.

_______________________________________________________________________________
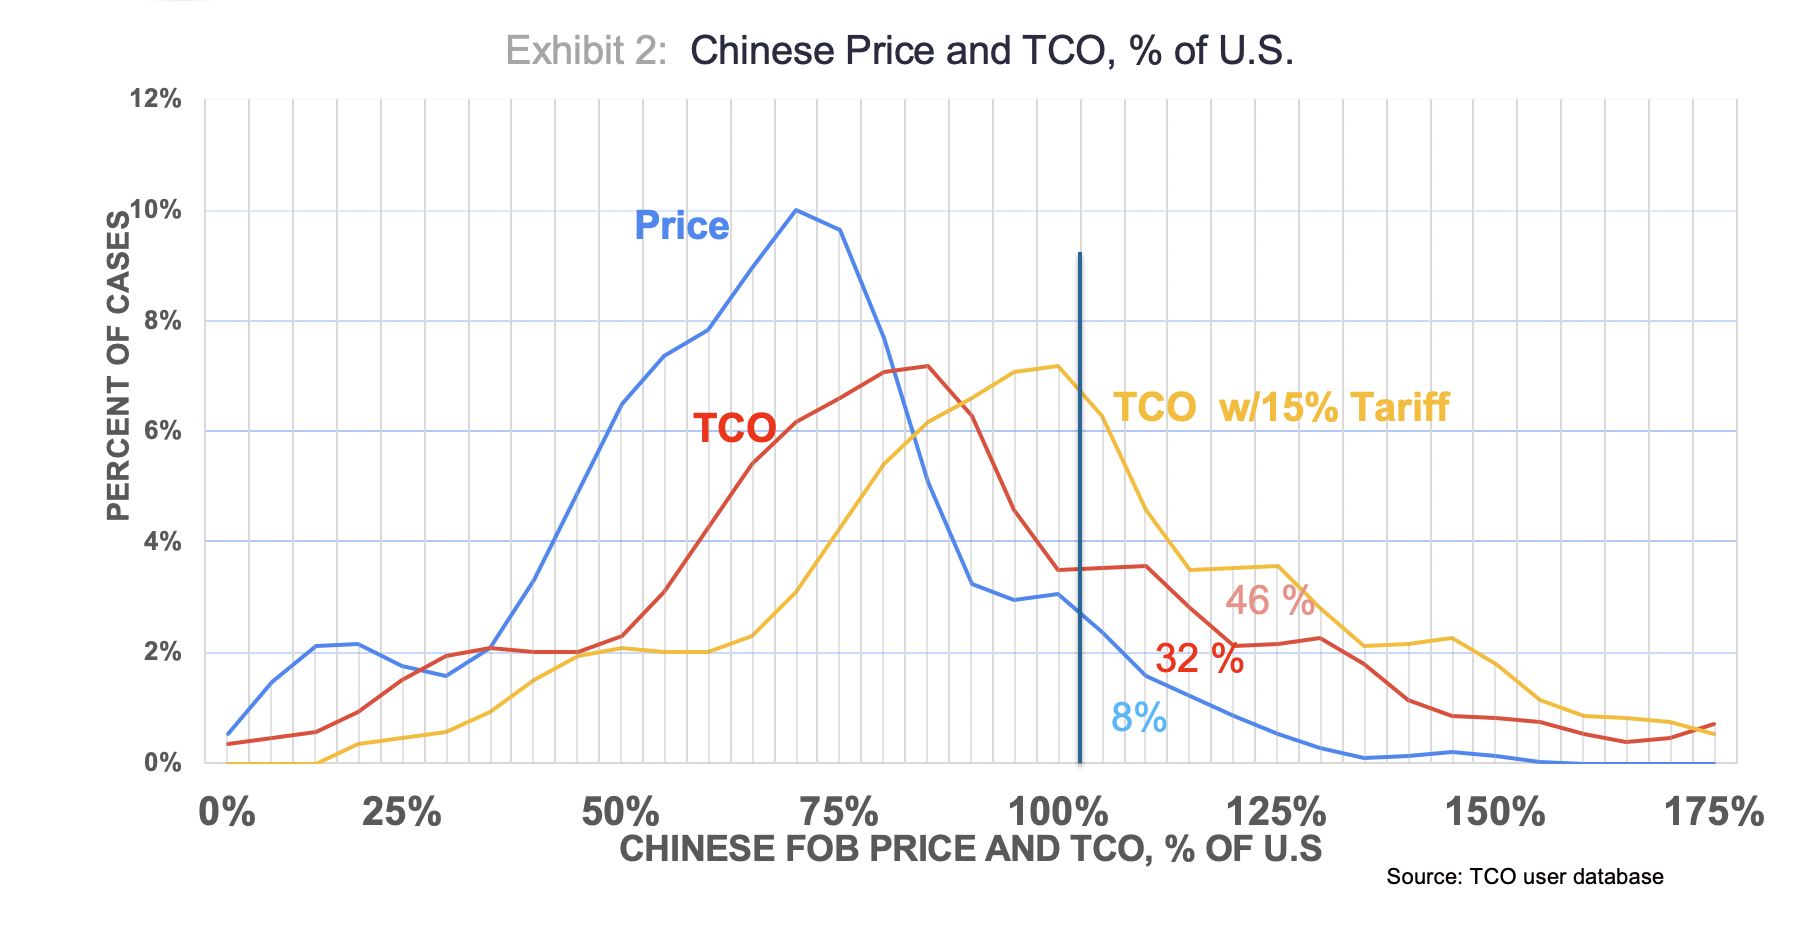
In Exhibit 2, the blue line is the same data as Exhibit 1, but smoothed. The red line shows the distribution of the TCO (Total Cost of Ownership) ratio for the same cases. The yellow line is the TCO ratio if a 15% Trump tariff is in effect. U.S. still wins above the 100% vertical line. The curves have shifted to the right, driving more of the area under the red and yellow curves above 100%. Eight percent of the cases have a Chinese price higher than the U.S. price. For TCO that rises to 32%. For TCO with a 15% Trump tariff to 46%.

_______________________________________________________________________________
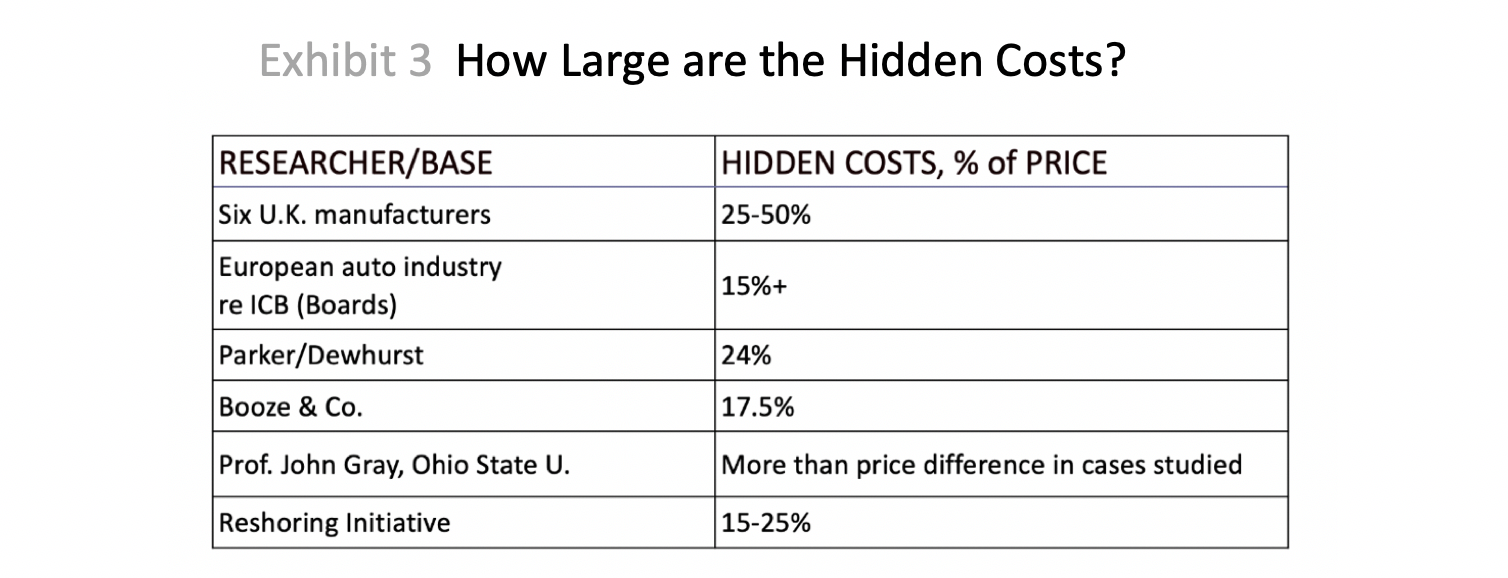
Exhibit 3: Various studies show the magnitude of the “Hidden Costs,” which are the difference between Ex Works price and TCO, and average about 20%, consistent with how much the TCO curve is to the right of the Price curve in Exhibit 2.

_____________________
Conclusions: 1. Using TCO has a huge impact on recognizing the overall feasibility of reshoring and identifying the best suited products.
2. 10 to 30% of Chinese imports would be reshored if companies consistently used TCO.
3. Similar data for the rest of the world would be overall even more favorable for the U.S.
China is highly competitive and our largest source of imports and has accounted for 49% of reshored jobs since 2010.
Related Resources: Free online
Total Cost Of Ownership Estimator® Free webinar,
Supply Chain Lesson Learned from COVID-19: How to Get Started with Total Cost Of Ownership (TCO)
- - -


