Competitiveness Toolkit
Project Objective:
To provide a national policy toolkit to balance the $700 billion/year U.S. manufactured goods trade deficit by leveling the playing field and increasing U.S. competitiveness.
Overview:
1. Level the playing field: Create a vetted national policy tool to select the optimal actions that will bring back the desired number of manufacturing jobs with the least collateral damage. The actions will also keep jobs from leaving and increase exports. 2. Overcome the wide belief that the U.S. cannot and will never again produce many of the products that have been lost to offshoring. Show that there is a path to adding millions of manufacturing jobs. 3. Advance from the current condition, many groups proposing, but not quantifying their solutions’ impacts, to a unified, quantified proposal for the nation.
Quantifying the Competitiveness Gap
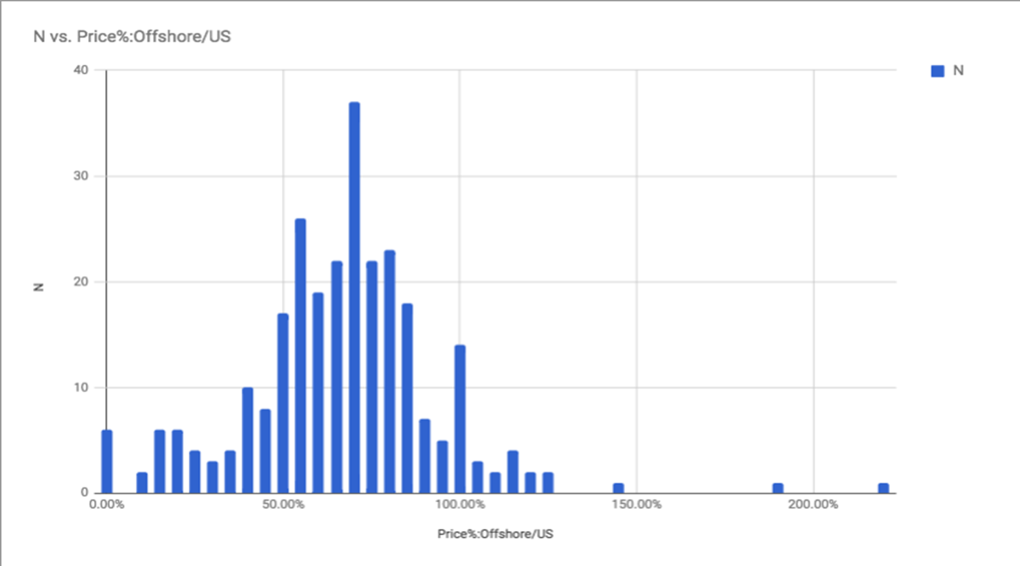
- FOB product price ratio distribution for the U.S. and offshore. Figure 1
- TCO price ratio for U.S. and offshore. Added into Figure 2. TCO includes user calculated “hidden” costs such as freight, duty, quality, delivery, IP, etc.
- By source country (esp. China) and industry


- The % ex-works and TCO competitiveness gaps by country and industry.
- The relationship between aggregate imports and competitiveness gap. The price-elasticity of imports.
- Percentage point improvement in U.S. price competitiveness needed to substitute domestic production for imports, reducing non-petroleum goods imports by X% and therefore the trade deficit by 3X%. First estimate in Figure 3.
- Competitiveness Toolkit: A list of policies and how much each would improve U.S. price competitiveness. Figure 4.
 Figure 4.
Project Plan:
- Insert their estimates and supportive logic if they differ from ours
- Insert additional factors and estimates


